Deadstock & Inventory Analysis and Automation
Someone shouldn’t be scrolling through 100 SKUs trying to spot what’s overstocked or about to run out.
Using two years of daily inventory data across 5 stores and 100 SKUs, this analysis focuses on two questions: What’s overstocked, and what’s about to run out?
This project turns that manual review into a script that flags what to reorder now and what’s quietly tying up cash.
Project Scope
Daily inventory data covering 100 SKUs across 5 stores over two years, split into two practical outputs: reorder alerts for stock that needs replenishment and a deadstock report for inventory tying up cash. The analysis uses a synthetic Kaggle dataset, with all derived outputs included in the project.
Business Questions
-
Overstock & Working Capital: Which SKUs are overstocked or slow moving, and how much working capital do they tie up.
-
Stockout Risk: Which SKUs are at risk of stocking out and need reordering right now.
-
Automation Feasibility: Can this review be automated instead of checked SKU by SKU.
Tools Used
-
Python (Pandas, NumPy)
-
Matplotlib / Seaborn
-
Inventory formulas

Days Of Inventory Cover
This histogram shows how many SKUs fall at each level of days of cover, how many days current stock would last at the average sales pace, with a dashed line marking the 2.8 day deadstock risk threshold. Most SKUs cluster well below that line, with only a handful stretching out past 3 days, so slow movers are clearly the exception here, not a sign of a catalog wide overstock problem.

Deadstock Value by Category
This shows how much money is tied up in slow moving stock, broken down by category. Electronics tops the list at nearly $190K, even though it isn't the category with the most products, just the one with the priciest slow movers.
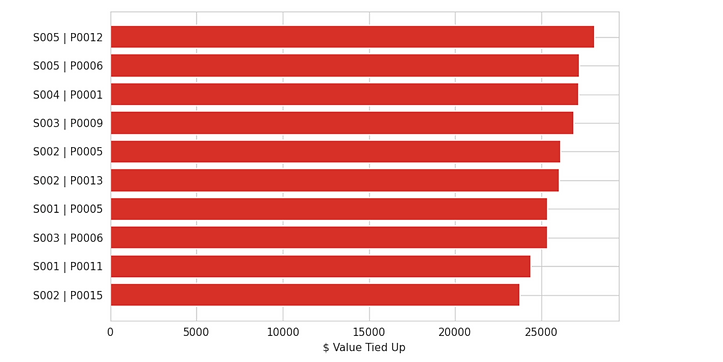
Top 10 Overstocked SKUs
This ranks the ten specific products holding the most stuck inventory value.Rather than one runaway SKU dragging the numbers down, these ten are tightly bunched between $24K and $28K each, suggesting a broad inventory discipline issue rather than one isolated mistake.

Reorder Alerts
This chart compares current inventory against the reorder point for the 15 most urgent SKUs, red bars show what's on hand, gold bars show what should be there.
All 15 are sitting well under their reorder point, some at less than a fifth of target stock, meaning they're already overdue for restocking.
What This Means for Your Business
Key Insights
-
62% of SKUs need restocking: 62 out of 100 are below their reorder point.
-
$590K is stuck in deadstock: 25 slow-moving SKUs hold about 40% of inventory value.
-
Electronics has the most deadstock: Around $189K is tied up.
Conclusion
This takes inventory analysis beyond a “here’s what happened” report. Run it on fresh data, and it tells you what needs to be reordered and what’s sitting around tying up money.
Future Scope
Next, the tool can use real supplier lead times, category-specific stock levels, scheduled reports, and suggested markdowns to make the process even more useful.
GitHub Link
Please click on the link for the detailed project on GitHub:
https://github.com/Rinitj/Deadstock-Inventory-Automation-Analysis
Rinit Jain
Home
About
Contact
Facebook
Twitter
LinkedIn
Tel. 123-456-7890
500 Terry Francine St.